Grafana monitoring#
Anaconda Server integrates with Grafana monitoring dashboards for your installation so you can view the status and health of your installation, as well as container logs, which are useful for troubleshooting your system.
You can access your Grafana dashboards in one of two ways:
Method one:
Navigate directly to the Grafana dashboards at http(s)://<FQDN>:3000 in your browser, where <FQDN> is your Anaconda Server fully qualified domain name, then log in using your Anaconda Server admin credentials.
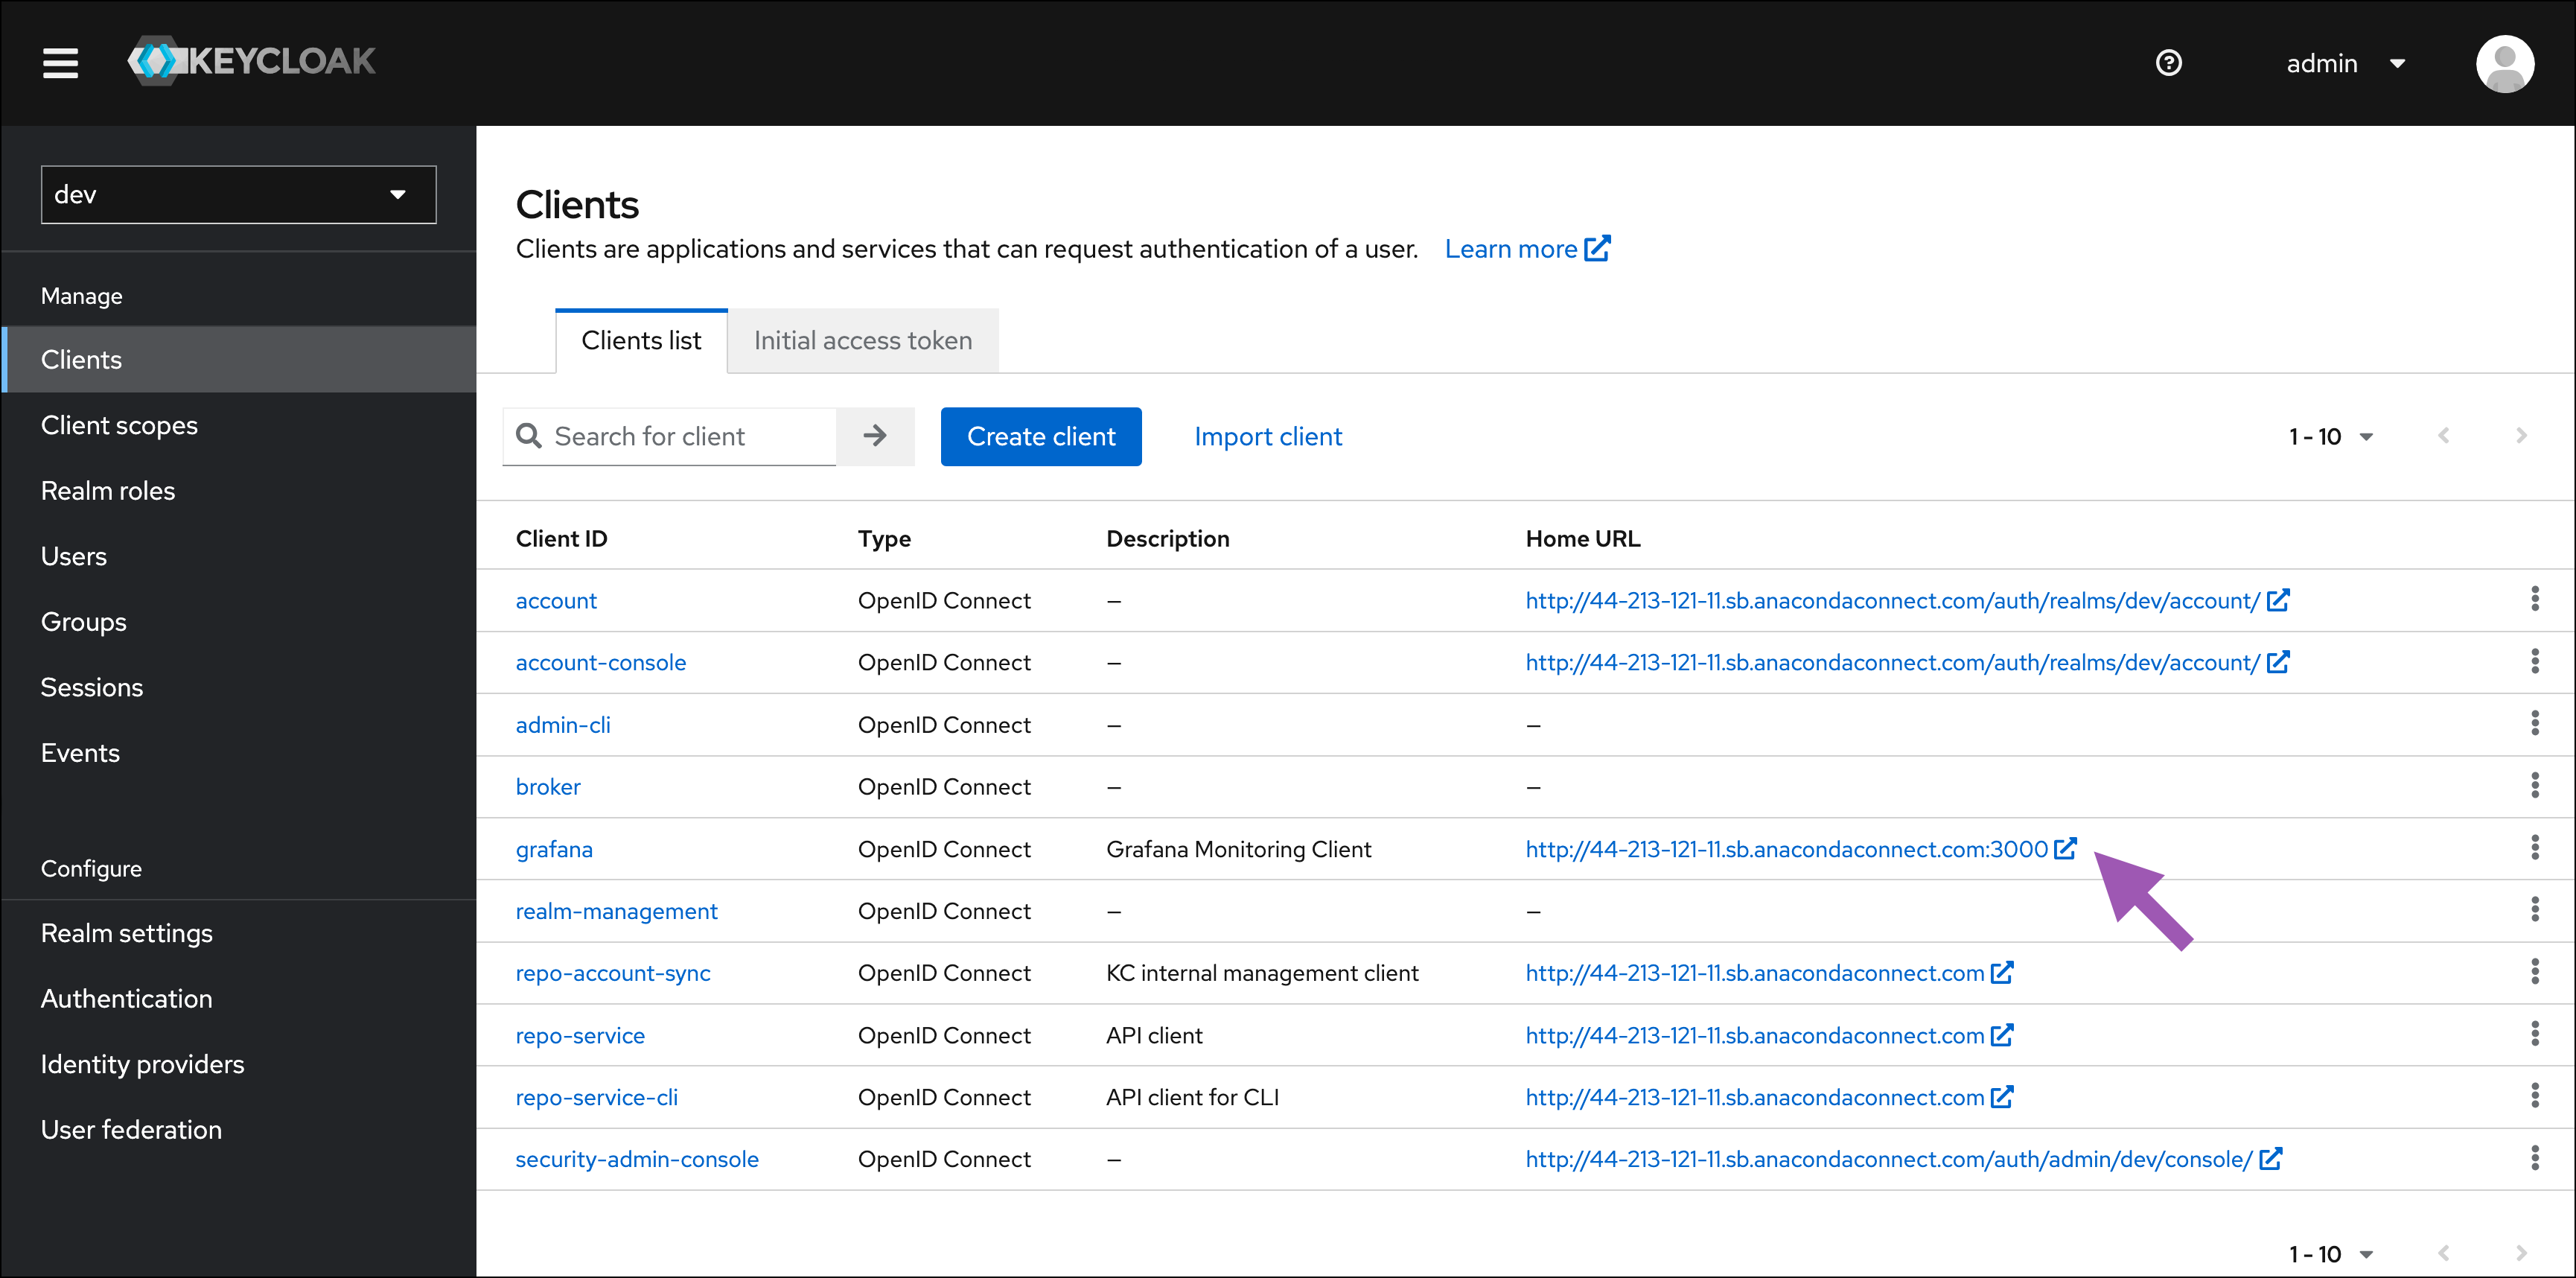
Method two: To access the Grafana dashboards via the Keycloak administrative console, complete the following steps:
If necessary, navigate to the Dev realm.
Select Clients from the left-hand navigation.
Click the Home URL link for the grafana client.

If you are logging in for the first time, use admin for both the username and password, set a new Grafana password, and then click Submit.

For further help using Grafana, see the official Grafana documentation.
Note
Upgrading will reset your Grafana username and password back to admin. You must update this password after upgrading Anaconda Server.